I read about AI the way most people do now, through charts in launch posts and threads, and almost every one of them has a ranking where one model beats another by a few points. I never knew which of those gaps I was supposed to believe. I do this in my spare time, and when Epoch AI flagged 30 of Terminal-Bench 4.0’s 66 tasks as defective, I started with a simple question to myself. If almost half the test is broken, does the ranking change? And if it doesn’t, what does that say about the ranking?
Every few weeks someone posts that an agent leaderboard is wrong. Either the tasks are broken, so the ranking means nothing, or the ranking uses the wrong metric (pass@1, the share of single tries that succeed, where it should use pass^k, which only counts a task if the agent solves it on every try) and so rewards lucky runs over reliable ones. Both complaints sound right to me.
Terminal-Bench is a benchmark of tasks an agent has to complete in a terminal, each checked by a test, and version 4.0 is one of the few leaderboards that publishes every individual trial. Ten of its 21 submissions are public, which gives ten configurations (a model plus the agent harness it ran in), 66 tasks and five trials each, 3,300 runs in all. The code and the data are in honest-agent-scores, and reproduce.py rebuilds every number below from the raw trials with fixed seeds, as long as those trials stay public.
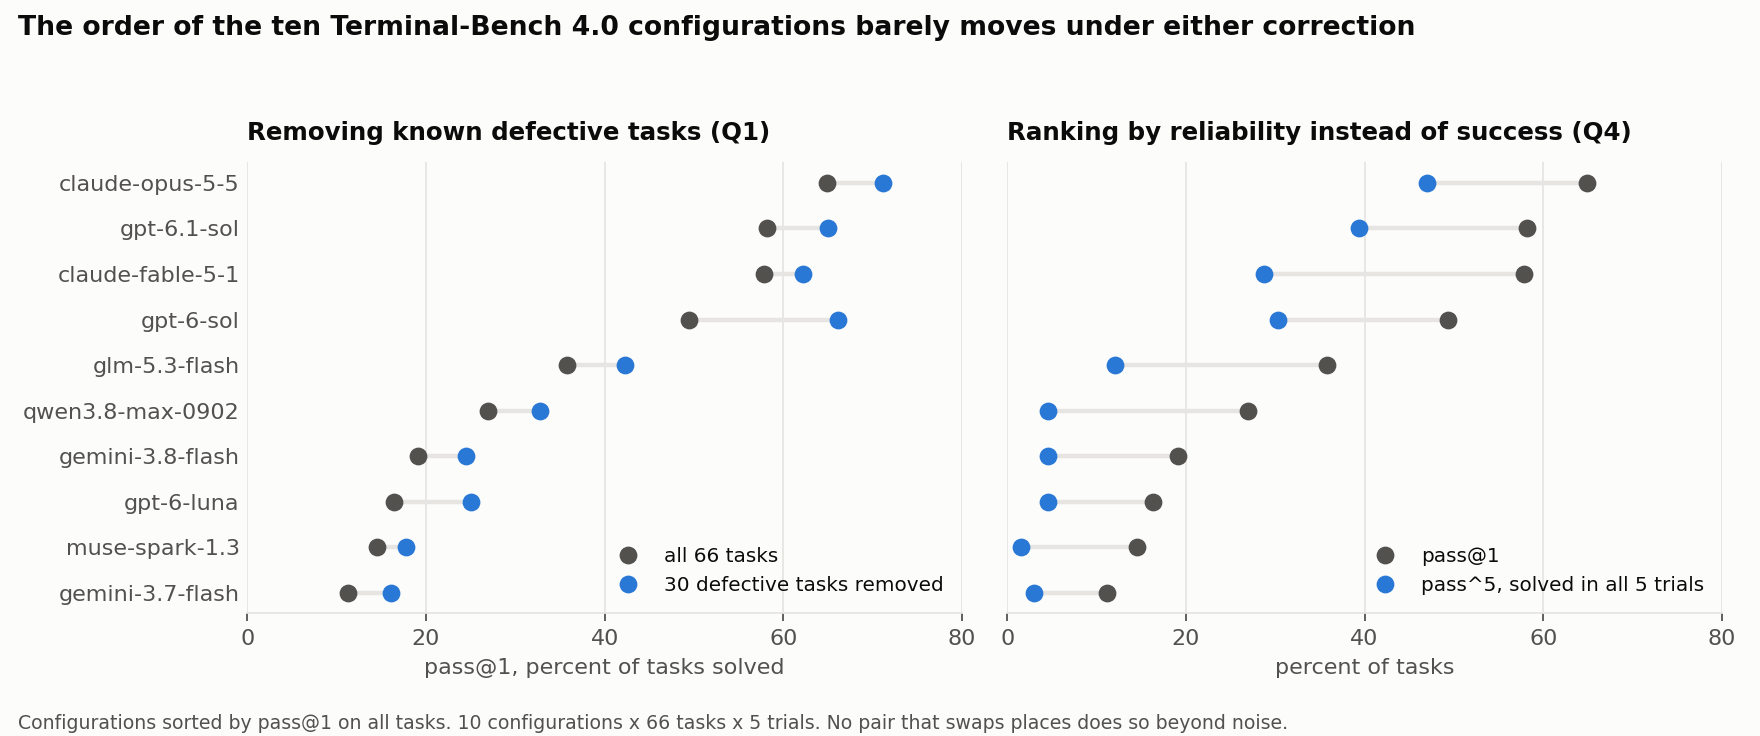
Neither fix reorders the ranking beyond noise, and I don’t think that says much about the fixes themselves. With 66 tasks, two agents need to be roughly ten points apart before you can tell which one is ahead, and most gaps between neighbouring places on this leaderboard (eight of nine) are smaller than that. Even the leader is only 6.7 points ahead of second place.
Think of it as an exam with 66 questions. If one student gets about 43 right and another about 38, you wouldn’t say the first one knows more, because a different set of 66 questions could easily flip them. That’s roughly where the top two agents on this leaderboard are.
| Configuration | pass@1 | pass^5 | pass^5 / pass@1 | pass@1, 36 unflagged tasks | pass@1, 19 tasks where a wrong answer can pass |
|---|---|---|---|---|---|
| Claude Opus 5.5 | 64.8 | 47.0 | 0.72 | 71.1 | 62.1 |
| GPT-6.1 Sol | 58.2 | 39.4 | 0.68 | 65.0 | 58.9 |
| Claude Fable 5.1 | 57.9 | 28.8 | 0.50 | 62.2 | 60.0 |
| GPT-6 Sol | 49.4 | 30.3 | 0.61 | 66.1 | 36.8 |
| GLM 5.3 Flash | 35.8 | 12.1 | 0.34 | 42.2 | 33.7 |
| Qwen 3.8 Max | 27.0 | 4.5 | 0.17 | 32.8 | 23.2 |
| Gemini 3.8 Flash | 19.1 | 4.5 | 0.24 | 24.4 | 16.8 |
| GPT-6 Luna | 16.4 | 4.5 | 0.28 | 25.0 | 4.2 |
| Muse Spark 1.3 | 14.5 | 1.5 | 0.10 | 17.8 | 9.5 |
| Gemini 3.7 Flash | 11.2 | 3.0 | 0.27 | 16.1 | 6.3 |
All numbers are percentages of tasks except the ratio.
I’m not the first to notice how small these gaps are. A post on LessWrong in August found that 24 of 25 neighbouring pairs on Terminal-Bench 2.0 were within noise, and a case study of the repairs between 2.0 and 2.1 found the ranking barely moved once 28 broken tasks were fixed (Spearman 0.958). An automated audit by Wang and colleagues went the other way and reported that dropping flagged tasks moves several Terminal-Bench 2 submissions by three or more places, but it doesn’t compare that with dropping random tasks. That comparison is what I wanted to make here on 4.0, along with a test of the second fix.
Fix one: remove the broken tasks
Epoch’s review splits the 30 flagged tasks into 19 where a wrong answer can pass and 11 where a right answer can fail. The obvious next step is to drop them and re-rank.
I did that, and three pairs of agents swap places. To see how much swapping happens by chance, I then threw out 30 random tasks instead, 10,000 times. The median is one swap and the 95th percentile is three, so three swaps sits at the edge of what random removal does on its own (p = 0.116). None of the three swapped pairs differs significantly after the removal. One pair is worth a second look, though. Claude Fable 5.1 is 8.5 points ahead of GPT-6 Sol on all tasks and 3.9 points behind on the unflagged ones, and that shift (-12.4 points, 95% CI from -21.9 to -3.8) does exclude zero. I picked that pair after seeing the data, out of 45 possible pairs and without correcting for that, so I’d treat it as something to check on new data and nothing more.
The flagged tasks are also the hard ones. All ten configurations do worse on them than on the rest, and that holds for the 19 tasks where a wrong answer can pass, which are the only ones where exploiting a defect would help. That fits “these tasks are just hard” better than “agents are exploiting them”, but it doesn’t rule exploitation out. A hole in a verifier could help some trials and still leave the average below the unflagged tasks, and seeing that would take the trajectories.
Fix two: rank by reliability instead of success
The second complaint is about the metric. pass@1 is the average success rate over single tries, and pass^5 is the share of tasks solved on all five tries. If you care about an agent you can actually hand work to, pass^5 is closer to what you want.
The leaderboard doesn’t show the ratio between the two, and it’s wild. pass^5 is 0.72 of pass@1 for Claude Opus 5.5 and 0.10 for Muse Spark 1.3, so some agents rarely repeat a success. Part of that is mechanical (the ratio falls as pass@1 falls, whatever the agent does), but at the top it may be real: Claude Fable 5.1 and GPT-6.1 Sol are level on pass@1 and ten points apart on pass^5 (not significant, the 95% CI runs from -22.7 to +1.5, and I picked this pair after seeing the data).
The ranking itself hardly changes. Under pass^5 two pairs swap and three weak configurations end up tied at 4.5, and none of the swaps is significant. The top two stay where they are, and Fable and GPT-6 Sol trade third and fourth. If you were choosing an agent from the leaderboard, pass^5 wouldn’t change your choice.
Why the swaps don’t mean much
For every pair of configurations I estimated how big a pass@1 gap has to be before it’s significant (the half-width of the 95% interval for the difference, bootstrapped over tasks). It varies by pair, and the median is 9.5 points. Below that, this benchmark can’t tell you which of two agents is ahead, so a swap between them tells you very little.
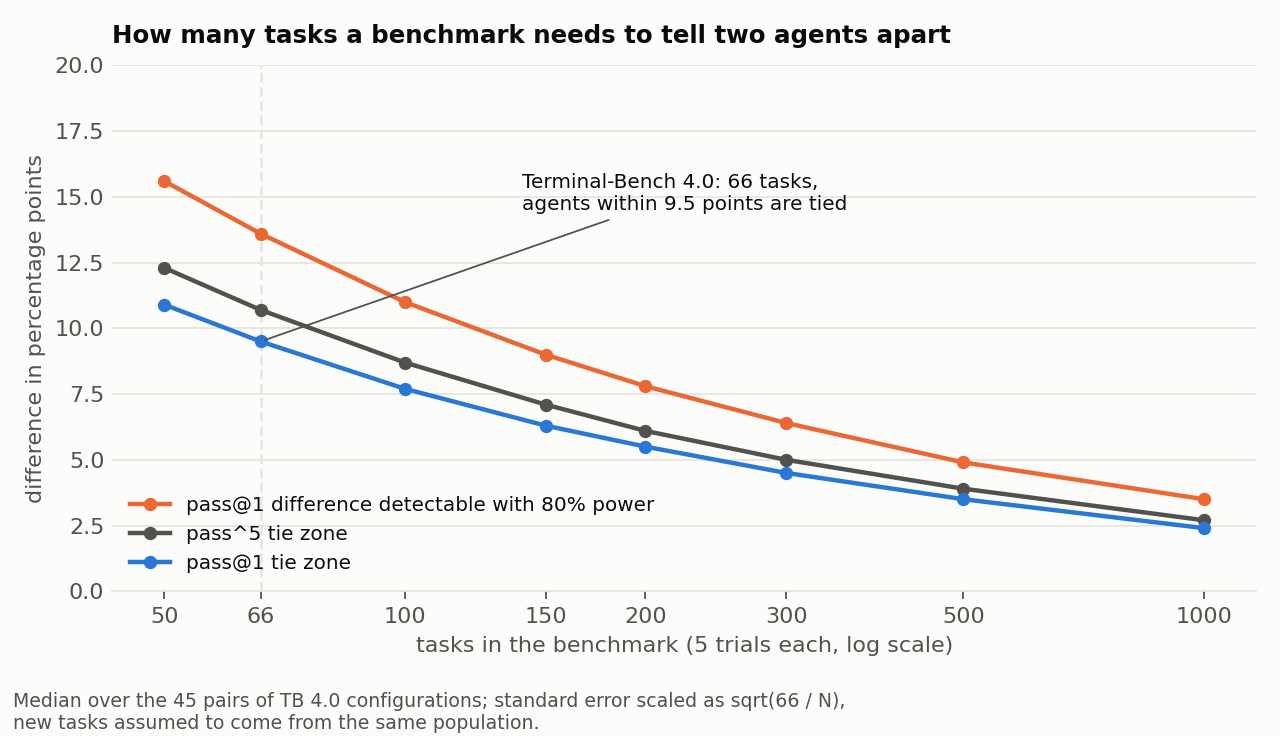
Calling a gap significant when you happen to see one is a lower bar than detecting it reliably. To detect a gap with 80% power on 66 tasks it has to be about 13.6 points. The tie zone shrinks to five points at about 240 tasks, and detecting a five point gap reliably takes about 500. Removing the 30 flagged tasks widens the zone (to about 13 points at 36 tasks), and pass^5 is a noisier number than pass@1, so its zone is 10.7 points. Eight of the nine gaps between neighbouring rows in the table above are below even the 9.5-point zone. I added this calculation after the planned tests, while writing things up.
So most of what the fixes change is smaller than what this measurement can resolve, which is about ten points. The top can be told apart from the bottom, and not much in between.
What I would do with this
If you read leaderboards, treat anything within about ten points as a tie on a benchmark of this size with five trials per task, and check the number of tasks before you look at the scores.
For people who run benchmarks, my one request is to publish per-trial results, and to say how many trials were relaunched. Everything above was possible only because Terminal-Bench publishes per-trial results, and the pass^5 to pass@1 ratio costs nothing to add (with the caveat that it falls with pass@1). If you have per-trial results of your own, the repository has a small script that takes a CSV of model, task, reward with at least five trials per task and reports the tie zone for your task count, whether your known defects change the ranking, and whether ICC (how consistent an agent’s repeats on the same task are) differs between models.
What this does not show
Ten configurations is low power, and not detecting a shift of one or two places isn’t the same as showing there’s none. Epoch’s review was partial (they stopped once the error rate crossed their threshold), so the 36 unflagged tasks haven’t been reviewed at all. The 11 private submissions aren’t in the sample and could change the picture if they become public. The full list of caveats is in docs/RESULTS.md.
I got something wrong on the way. My first draft said that because the attempt field is 1 on every trial, I couldn’t check whether the five repeats were independent. Reading the leaderboard code, it looks more like only the latest run of each trial is kept, and the rules allow submitters to relaunch trials. That raises a different question, whether a run that failed cleanly can be rerun, and the data can’t answer it. I’ve asked the maintainers.
I also looked at whether agents differ in how consistent their repeats are, on the larger Terminal-Bench 2.0 data. The answer is more tangled than the rest of this post (much of the difference tracks pass@1, what’s left isn’t clearly above noise, and the 28 tasks the benchmark later changed carry much of the signal), so it’s written up with all its caveats in RESULTS.md and I’ll come back to it separately.
One more thing I ran into while collecting the data: the public Terminal-Bench 2.0 dataset on Hugging Face lists every trial twice in 11 of its configurations, 4,952 duplicate rows in all. The rewards agree, so averages survive, but anything that samples trials doesn’t. I reported it here, and the fetch script in the repository deduplicates on download.
Code and data: github.com/anaexplores/honest-agent-scores, archived at doi.org/10.6084/m9.figshare.34515048. The defect list is from the Epoch AI review, the trials from the leaderboard submissions on Harbor Hub and Hugging Face.